Life cycle assessment (LCA), in simplified definition, is a task that uncovers all environmental effects a process or a product creates. It is a difficult task and one that is complex. Why is it so complex? Mainly, because the environment can be harmed in multiple ways and because emissions can have multiple levels of impact.
The six goals of LCA
A usual life cycle analysis focuses on six different goals or six ways in which the environment needs to be protected. To mention the most important ones: there is the greenhouse effect, the ozone hole, eutrophication, noise emission, human toxicity and eco toxicity. Including all six of these concerns in a single analysis takes a lot of expertise and requires sophisticated LCA tools.
What is a Carbon Footprint? A reduced Life Cycle Assessment
The complexity of LCA, however, can be drastically reduced by limiting the analysis to one single environmental effect. That is exactly what carbon footprints allow: a reduced LCA that exclusively assesses one type of emission, or one type of in- and output.
By reducing the complexity of LCAs to one level of impact, you take life cycle thinking one step toward practical relevance. This is the reason why full LCAs seem to remain prominent in the academic sector, whereas carbon footprints have clearly entered into wide-spread use in business.
Life Cycle Thinking for Practitioners: Single Score Footprinting
Results for carbon footprints, be it for organizations, processes or products, comprise one figure. One figure, one single score, can be compared to others. As long as you follow a uniform methodology, e.g. ISO 14067 for carbon footprinting, this single score is very significant. Product carbon footprints which show the carbon footprint figure for one functional entity, hence one product, have a huge potential for customers to compare products and choose the least polluting.
Comparable results are satisfying, but not the only advantage of “single score footprinting”. Prof. Dr. Mario Schmidt, expert for industrial ecology, argues that conventional cost accounting methods can easily be transferred to footprinting analysis. How that works? We have summarized it in the following.
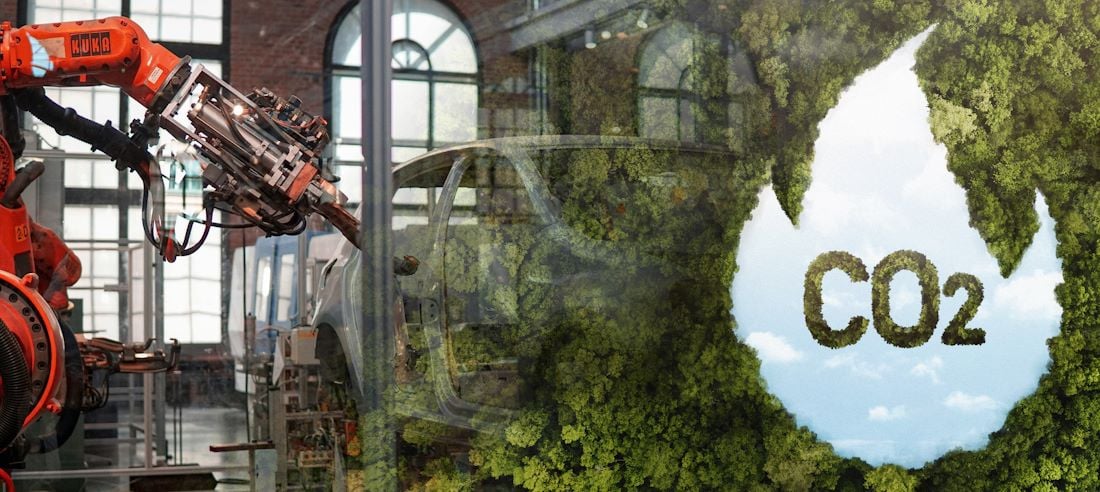
Carbon Footprint: Accumulates All Greenhouse Gas Emissions
In a complex production system, the production process consists of many sub-processes. Every sub-process “inherits” carbon emissions from its predecessor, and generates further direct emissions on top. The final product, which results from all the steps of the production process, possesses their accumulated GHG emissions.
Greenhouse gas emissions, when visualized, usually follow an arrow pointing up into the air, since this is how carbon dioxide is imagined to enter the atmosphere. The following sankey diagram, however, shows us a view of emissions going the other way: carbon-equivalent emissions point downwards, into the process. The logic behind this visualization is clear: emissions are cumulative. Remember? Accumulated GHG emissions.
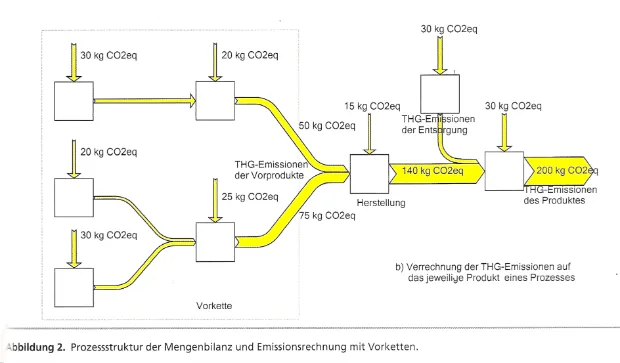
Process structure and emission calculation including the upstream chain. Material flow model with CO2-equivalents created with the software Umberto.
But how can you assign a certain level of emissions to the following production stream where there are two or more interrelated processes and/or benefits? This question arises from what business economists call joint products, and correct allocation is needed. To give you an example:
A sub-process generates a product (good) and waste (bad). What happens if you can sell the waste as a raw material instead? In this case, the same sub-process generates a product (good) and another product (also good). In the following illustration, this is shown as process B. Processes B and C don’t necessarily need to happen in the same company. The difficulty is determining how much of the process emissions need to be assigned to one and how much to the other product.
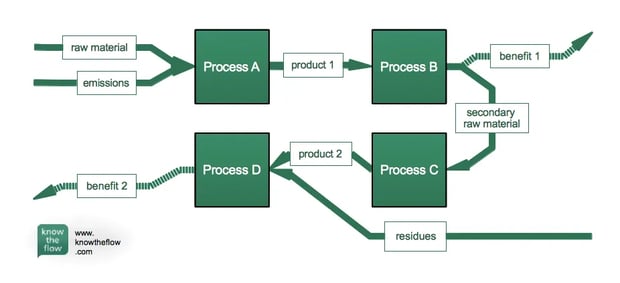
Allocation problem because of various benefits and recycling of material. Material flow model created with the software Umberto.
Emission x Factor = Material x Unit Cost
There are two ways in which traditional accounting would solve this problem. Why traditional accounting? Because the ecological footprinting perspective is very similar to the financial accounting one. Really? Yes, just change the units: in footprinting, you have
[weight of GHG emission] x [emission factor]
whereas with cost accounting you have
[amount of material] x [unit costs]
OK, but what is it good for? The accounting methods are well developed and tested and allocation of overhead expense, for example, is extremely useful regarding product carbon footprints, and easily feasible, too.
Allocation: by Amount or by Market Price?
Back to resolving the allocation problem. One of the two methods looks at product amount, in weight or in pieces. You can find this approach in ISO 14040 on environmental management. The other approach allocates costs (in accounting) or emissions (in footprinting) by market prices. The latter can be found in PAS 2050, the British standard on carbon footprinting. So, if a process results in 9 kg of product A, worth $3 and 1 kg of product B, worth $7 our first approach would allocate 90% of the emissions to product A, whereas only 30% of the emissions would be allocated to it using the market price approach. Got it?
I hope to have given you some insight into the possibilities of cost accounting in carbon footprinting.
Original article written by Moritz Bühner.
Article image by Keith Williamson.
References:
Schmidt, M.,2011. Von der Material- und Energieflussanalyse zum Carbon Footprint – Anleihen aus der Kostenrechnung .Chemie Ingenieur Technik